If you're planning on building a user-generated content (UGC) platform with Amazon Interactive Video Service (Amazon IVS), then you'll likely want to integrate some sort of dashboard to monitor the health of your user's live streams. As always, the documentation provides a great overview of monitoring stream health.
In this post we'll go a bit further and show some examples of how to retrieve stream sessions, and retrieve health metrics for a live stream from Amazon CloudWatch. As an added bonus, we'll also look at generating a few useful charts that can be added to your UGC dashboard for realtime health monitoring.
Amazon IVS stream health metrics are stored in Amazon CloudWatch. To retrieve these metrics with the AWS SDK for JavaScript v3, we can use the GetMetricDataCommand method docs from the Amazon CloudWatch client (@aws-sdk/client-cloudwatch).
This method expects a few properties to filter the metrics to a specific time period and Amazon IVS channel as we'll see below.
Note: This post will focus on retrieving stream health metrics with the Amazon CloudWatch SDK, but vital stream health metrics can also be observed via Amazon EventBridge so you can take any necessary action when a stream becomes unhealthy or service limits are breached. Refer to the documentation for more information.
Retrieving Amazon IVS Stream Sessions
Since we need a StartTime and EndTime to retrieve health metrics, it makes sense to retrieve a list of recent stream sessions via the Amazon IVS client (@aws-sdk/client-ivs). To do this, we can use ListStreamSessionsCommand (docs) and pass it the ARN for the channel that we're interested in.
import { IvsClient, ListStreamSessionsCommand } from "@aws-sdk/client-ivs";

const ivsClient = new IvsClient();
const listStreamSessionsInput = {
  channelArn: process.env.DEMO_CHANNEL_ARN,
  maxResults: 3, // default=100
};
const listStreamSessionsRequest = new ListStreamSessionsCommand(listStreamSessionsInput);
const listStreamSessionsResponse = await ivsClient.send(listStreamSessionsRequest);

console.log(listStreamSessionsResponse)
The response from ListStreamSessionsCommand will return an object. The streamSessions key in that object contains an array of stream sessions, sorted by the most recent session. Active sessions are indicated by the absence of an endTime.
{
  "$metadata": {
    "httpStatusCode": 200,
    "requestId": "[redacted]",
    "cfId": "[redacted]",
    "attempts": 1,
    "totalRetryDelay": 0
  },
  "nextToken": "AQI...[redacted]...A==",
  "streamSessions": [
    {
      "endTime": undefined,
      "hasErrorEvent": false,
      "startTime": "2023-01-20T14:30:11.000Z",
      "streamId": "st-[redacted]"
    },
    {
      "endTime": "2023-01-19T16:12:37.000Z",
      "hasErrorEvent": false,
      "startTime": "2023-01-19T16:12:29.000Z",
      "streamId": "st-[redacted]"
    },
    {
      "endTime": "2023-01-19T16:12:25.000Z",
      "hasErrorEvent": false,
      "startTime": "2023-01-19T16:12:22.000Z",
      "streamId": "st-[redacted]"
    }
  ]
}
Retrieving a Single Stream Session
At this point, we have could use these timestamps to retrieve our stream metrics. But, it might be useful to grab a bit more detail such as the audio and video ingest configuration. To retrieve this info, we can use GetStreamSessionCommand (docs). This method expects the ARN, and a streamId which we have already obtained in the above result.
import { IvsClient, GetStreamSessionCommand } from "@aws-sdk/client-ivs";
import util from "node:util";

const ivsClient = new IvsClient();
const getStreamSessionInput = {
  channelArn: process.env.DEMO_CHANNEL_ARN,
  streamId: 'st-[redacted]'
};
const getStreamSessionRequest = new GetStreamSessionCommand(getStreamSessionInput);
const getStreamSessionResponse = await ivsClient.send(getStreamSessionRequest);

console.log(
  util.inspect(getStreamSessionResponse, false, null, true)
);
The GetStreamSessionCommand method returns information about the session (in this case, an active live stream). Notice that ingestConfiguration contains some handy items like the codec, bitrate, framerate, etc. The truncatedEvents object contains all of the events that have been triggered for this particular stream.
{
  "$metadata": {
    "httpStatusCode": 200,
    "requestId": "[redacted]",
    "cfId": "[redacted]",
    "attempts": 1,
    "totalRetryDelay": 0
  },
  "streamSession": {
    "channel": {
      "arn": "[redacted]",
      "authorized": false,
      "ingestEndpoint": "[redacted]",
      "latencyMode": "LOW",
      "name": "demo-channel",
      "playbackUrl": "[redacted]",
      "recordingConfigurationArn": "[redacted]",
      "type": "STANDARD"
    },
    "ingestConfiguration": {
      "audio": {
        "channels": 2,
        "codec": "mp4a.40.2",
        "sampleRate": 48000,
        "targetBitrate": 128000
      },
      "video": {
        "avcLevel": "3.1",
        "avcProfile": "Baseline",
        "codec": "avc1.42C01F",
        "encoder": "",
        "targetBitrate": 8500000,
        "targetFramerate": 30,
        "videoHeight": 1080,
        "videoWidth": 1920
      }
    },
    "recordingConfiguration": {
      "arn": "[redacted]",
      "destinationConfiguration": {
        "s3": {
          "bucketName": "[redacted]"
        }
      },
      "state": "ACTIVE"
    },
    "startTime": "2023-01-20T14:30:11.000Z",
    "streamId": "st-[redacted]",
    "truncatedEvents": [
      {
        "eventTime": "2023-01-20T14:30:19.000Z",
        "name": "Recording Start",
        "type": "IVS Recording State Change"
      },
      {
        "eventTime": "2023-01-20T14:30:18.000Z",
        "name": "Stream Start",
        "type": "IVS Stream State Change"
      },
      {
        "eventTime": "2023-01-20T14:30:11.000Z",
        "name": "Session Created",
        "type": "IVS Stream State Change"
      }
    ]
  }
}
Viewing Stream Health Metrics via the AWS Console
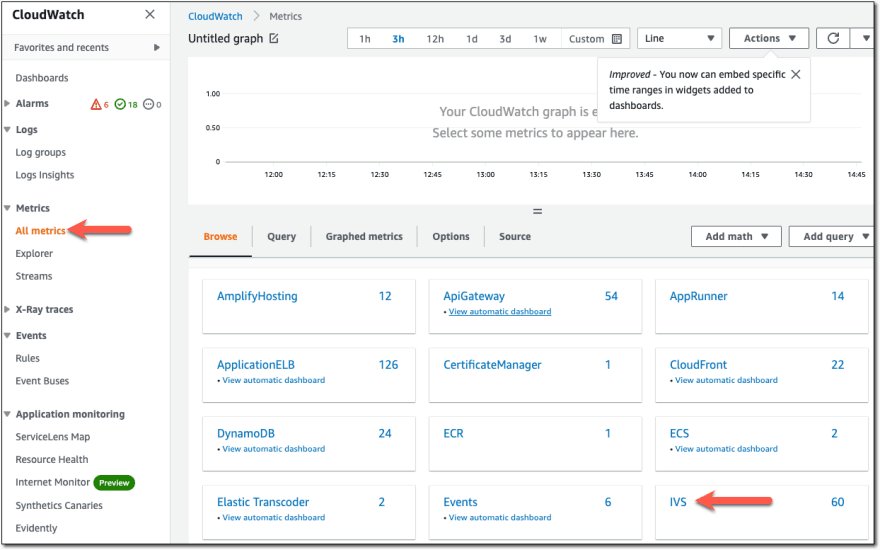
If you're planning to integrate stream health metric data into your application, you will be using one of the AWS SDKs. But, if you're just looking to view health metric data on a less frequent basis, you can view them via the AWS Console. To view Amazon IVS related health metrics, select All metrics, then IVS via the Amazon CloudWatch console.
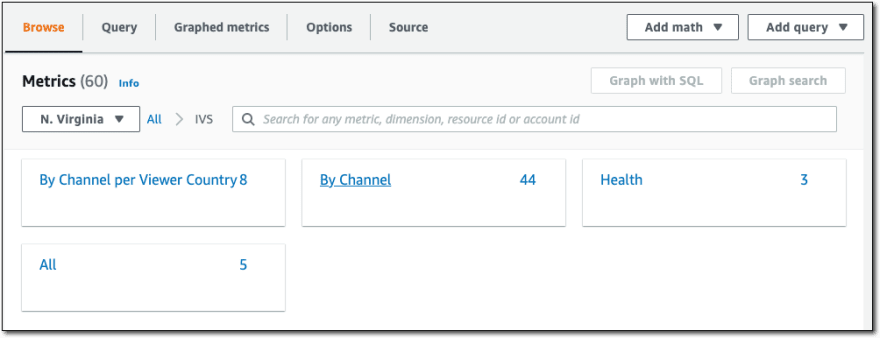
We can browse metric data by choosing a dimension.
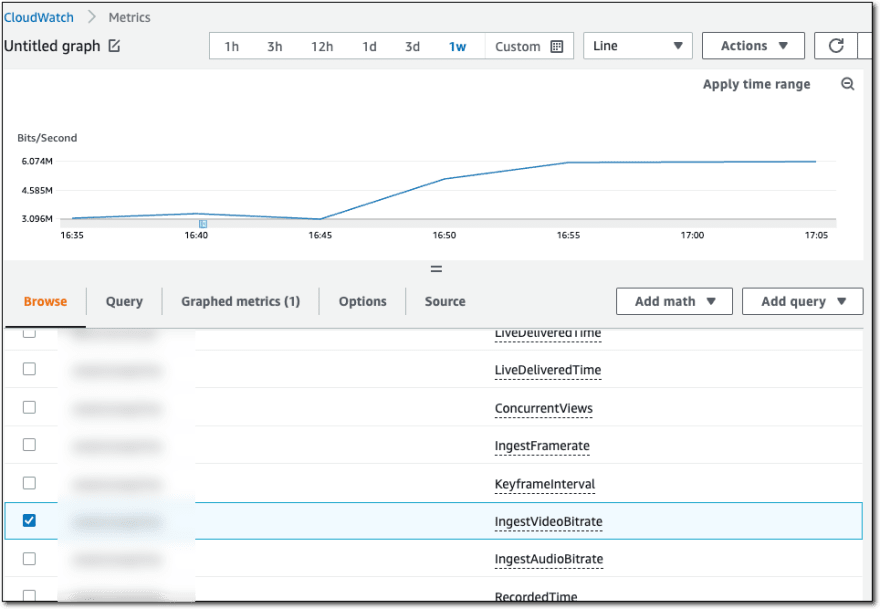
For example, to view metrics by channel, select By channel, and choose the desired time period, the channel, and the metric.
Retrieving Stream Health Metrics via the SDK
We're ready to use the Amazon CloudWatch SDK to pull back health metric data for a channel based on the stream start and end times. GetMetricDataCommand expects a GetMetricDataCommandInput object (docs).
As mentioned above, this object has StartTime and EndTime properties, as well as a MetricDataQueries property that should contain an array of queries depending on the health metrics that we'd like to retrieve. There are four properties related to Amazon IVS channel health that we're interested in here: IngestAudioBitrate, IngestVideoBitrate, IngestFramerate, and KeyframeInterval. We'll construct an array for each metric, using AWS/IVS as the Namespace and filtering on a specific channel by grabbing the portion of the channel ARN following /.
import { CloudWatchClient, GetMetricDataCommand } from "@aws-sdk/client-cloudwatch";

const cloudWatchClient = new CloudWatchClient();
const getMetrics = async (arn, startTime, endTime) => {
  const streamHealthMetrics = [
    "IngestAudioBitrate",
    "IngestVideoBitrate",
    "IngestFramerate",
    "KeyframeInterval"
  ];
  const metricDataQueries = streamHealthMetrics.map((metric) => {
    return {
      Id: metric.toLowerCase(),
      MetricStat: {
        Metric: {
          MetricName: metric,
          Namespace: "AWS/IVS",
          Dimensions: [{ Name: "Channel", Value: arn.split("/")[1] }]
        },
        Period: 5,
        Stat: "Average",
      }
    }
  });

  const getMetricDataInput = {
    StartTime: startTime,
    EndTime: endTime,
    MetricDataQueries: metricDataQueries,
    MaxDatapoints: 100
  };

  const getMetricDataRequest = new GetMetricDataCommand(getMetricDataInput);
  const getMetricDataResponse = await cloudWatchClient.send(getMetricDataRequest);
  return getMetricDataResponse;
};

// get metrics for a session

const metrics = await getMetrics(
  process.env.DEMO_CHANNEL_ARN,
  new Date('2023-01-20T14:30:11.000Z'),
  new Date('2023-01-20T14:49:15.000Z')
);
The result of calling GetMetricDataCommand will look similar to the following output:
{
  "$metadata": {
    "httpStatusCode": 200,
    "requestId": "[redacted]",
    "attempts": 1,
    "totalRetryDelay": 0
  },
  "MetricDataResults": [
    {
      "Id": "ingestaudiobitrate",
      "Label": "IngestAudioBitrate",
      "Timestamps": [
        "2023-01-20T14:49:10.000Z"
      ],
      "Values": [
        31049.333057821852
      ],
      "StatusCode": "PartialData"
    },
    {
      "Id": "ingestvideobitrate",
      "Label": "IngestVideoBitrate",
      "Timestamps": [
        "2023-01-20T14:49:10.000Z"
      ],
      "Values": [
        3497988.4859657455
      ],
      "StatusCode": "PartialData"
    },
    {
      "Id": "ingestframerate",
      "Label": "IngestFramerate",
      "Timestamps": [
        "2023-01-20T14:49:10.000Z"
      ],
      "Values": [
        29.143738984724312
      ],
      "StatusCode": "PartialData"
    },
    {
      "Id": "keyframeinterval",
      "Label": "KeyframeInterval",
      "Timestamps": [
        "2023-01-20T14:49:10.000Z"
      ],
      "Values": [
        2.007629037
      ],
      "StatusCode": "PartialData"
    }
  ],
  "NextToken": "[redacted]",
  "Messages": []
}
It's important to note that Amazon CloudWatch metrics are rolled up over time, so granular resolution decreases over time.
- 1-second metrics are available for 3 hours.
- 60-second metrics are available for 15 days.
- 5-minute metrics are available for 63 days.
- 1-hour metrics are available for 455 days (15 months).
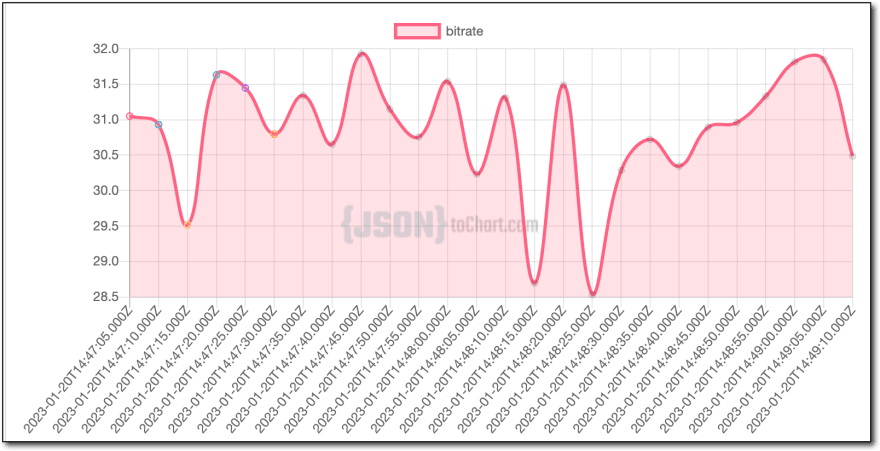
If we were to run the same query with a larger time range (depending on the availability of the data as mentioned above), we can filter and group the data based on a single metric and use that result to render a nice chart of the values.
const videoBitrateMetrics = metrics
  .MetricDataResults
  .find((metric) => metric.Id === 'ingestvideobitrate');

const bitrateData = [];

videoBitrateMetrics.Timestamps
  .sort((a, b) => new Date(a) > new Date(b) ? 1 : -1)
  .forEach((t, i) => {
    bitrateData.push({
      timestamp: t,
      bitrate: videoBitrateMetrics.Values[i] / 1000,
    })
  });

console.log(JSON.stringify(bitrateData));
This produces an array of objects that looks like the following:
[
  {
    "timestamp": "2023-01-20T14:47:05.000Z",
    "bitrate": 3497.9884859657454
  }
]
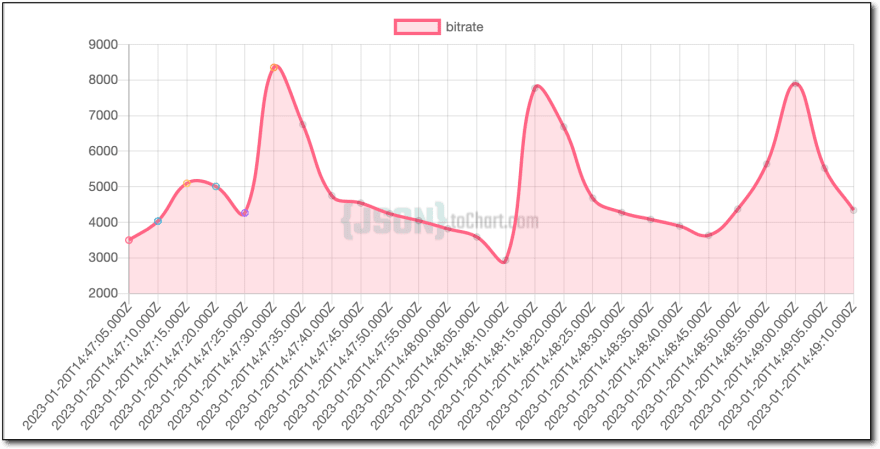
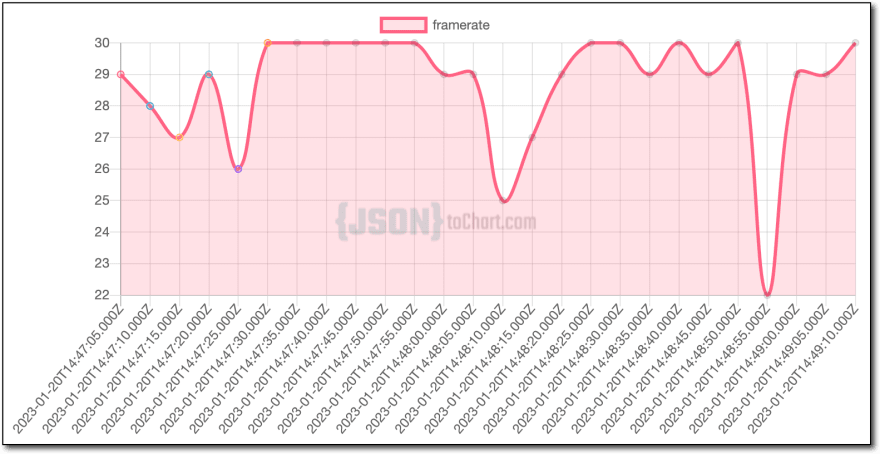
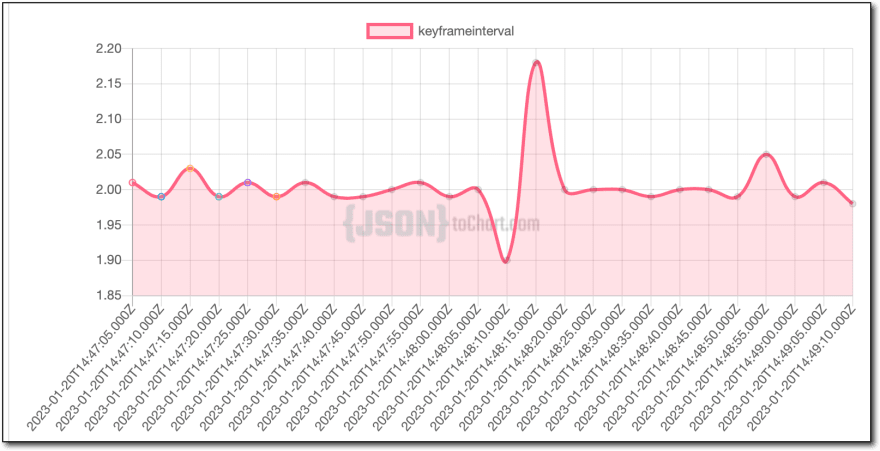
We can use this filtered data to create some nice visualizations for our UGC dashboards. Some quick examples:
Ingest Video Bitrate
Ingest Audio Bitrate
Ingest Framerate:
Keyframe Interval:
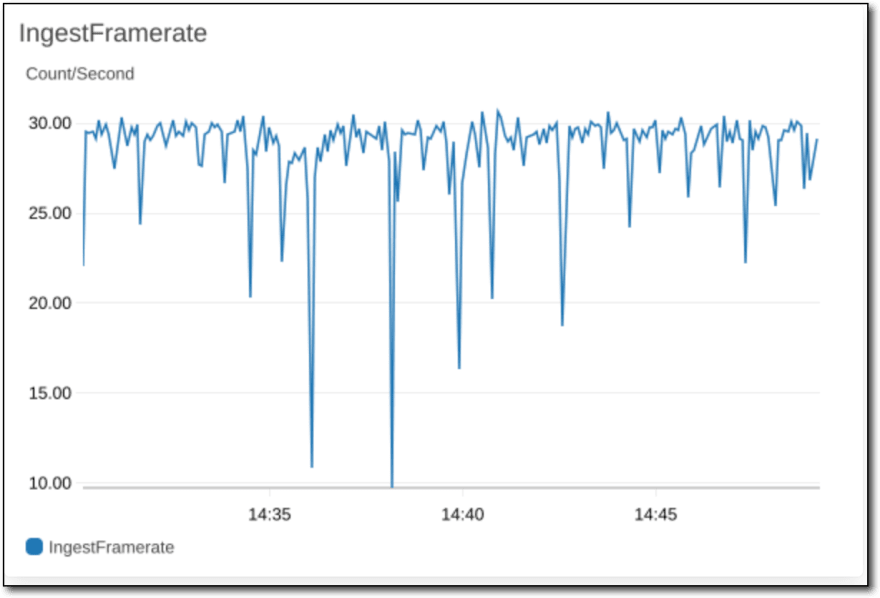
Generating Chart Images with the Amazon CloudWatch SDK
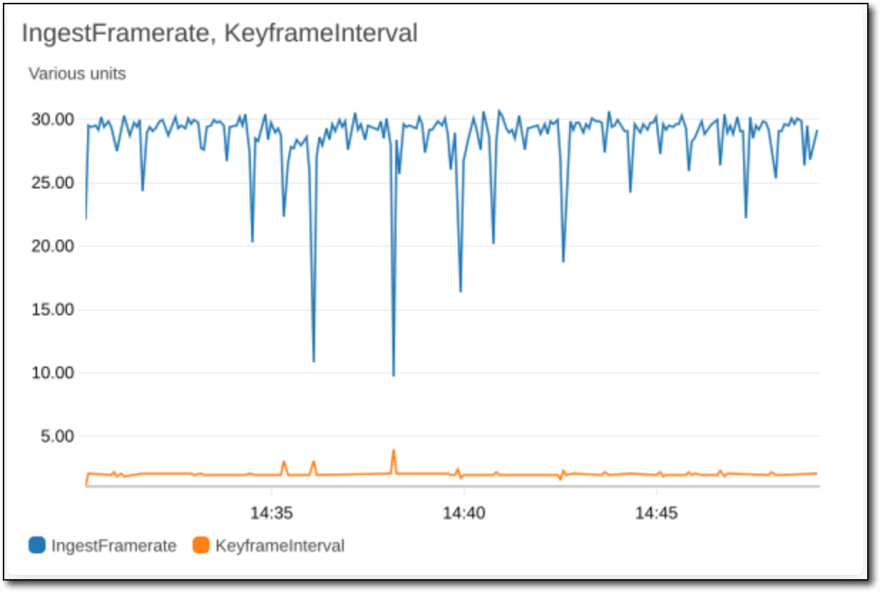
Another super cool option is to generate the charts directly via the Amazon CloudWatch SDK. Check the documentation for details. Here's an example of generating a chart for the IngestFramerate metric via the Amazon CloudWatch SDK.
const getMetricImage = async (arn, startDate, endDate) => {
  const cloudWatchClient = new CloudWatchClient();
  const getMetricWidgetImageInput = {
    MetricWidget: JSON.stringify({
      metrics: [
        [
          "AWS/IVS",
          "IngestFramerate",
          "Channel",
          arn.split("/")[1]
        ]
      ],
      start: startDate,
      end: endDate,
      period: 5
    })
  };
  const getMetricWidgetImageRequest = new GetMetricWidgetImageCommand(getMetricWidgetImageInput);
  const getMetricWidgetImageResponse = await cloudWatchClient.send(getMetricWidgetImageRequest);
  return getMetricWidgetImageResponse;
};

const metricImage = await getMetricImage(
  process.env.DEMO_CHANNEL_ARN,
  new Date('2023-01-20T14:30:11.000Z'),
  new Date('2023-01-20T14:49:15.000Z')
);
The call to GetMetricWidgetImageCommand returns a JSON object that looks like the following:
{
  '$metadata': {
    httpStatusCode: 200,
    requestId: '[redacted]',
    extendedRequestId: undefined,
    cfId: undefined,
    attempts: 1,
    totalRetryDelay: 0
  },
  MetricWidgetImage: Uint8Array(36660) [
    137, 80, 78,
    ... 36560 more items
  ]
}
We can convert the Uint8Array to a base64 string:
const buffer = Buffer.from(metricImage.MetricWidgetImage);
console.log(buffer.toString('base64'));
Which returns a base64 string:
iVBORw0KGgoAAAANSUhEUgAAAlgAAAGQCAIAAAD9V4nPA...
That can be used to render an image:
We can weven combine multiple metrics in a single image by passing additional metrics to GetMetricWidgetImageCommand.
Summary
In this post, we looked at how to retrieve health metrics for an Amazon IVS live stream and render them as charts. Stay tuned for a future post where we dig into some of the other metrics available via Amazon CloudWatch related to live stream viewers.