Customer Satisfaction is the key feature that helps in business growth.
We have seen many companies in the past that collapsed as they didn’t pay much attention to their customer support system.
For a company, the customers are as much precious as their product. In the United States, the Consumer Financial Protection Bureau basically collects the data on the customer complaints and company responses to complaints to analyze the data and help the government make new laws. This dataset is publicly available on “consumerfinance.gov”.
What makes this case study interesting?
This case study works as a two-way benefit:
- For companies: It helps to find out which factors the particular company needs to work on.
- For customers: It helps customers select the company for the products they want and see which company provides the best customer support.
Why Supervised Learning?
The case study is integrated using supervised learning.
What is Supervised Learning?
In this type of learning, we have labeled input data. This means that the data presented to the model already contains the correct answer. We are giving this pre-labeled data to make the model learn from it. This means if data with similar features is given to the machine in the future, it will recognize it.
The type of supervised learning used is Classification.
Classification Supervised Learning: It specifies the category to which data elements belong and is best used when the output has finite and discrete values. It predicts a category for an input variable also.
In our dataset, we have to find out whether the customer is satisfied or not from the resolution so it comes under two-class classification supervised learning.
Collecting Data
As you know, machines initially learn from the data that you give them. It is of the utmost importance to collect reliable data so that your machine learning model can find the correct patterns. The quality of the data that you feed to the machine will determine how accurate your model is. If you have incorrect or outdated data, you will have wrong outcomes or predictions which are not relevant.
The first step was to load the dataset, which was done using pandas.
Exploring Dataset
The dataset contains 555957 observations and 18 features available for analysis. After the analysis, it was observed that there are many columns and rows which have null values.
Description of columns:
- Date received: The date the CFPB received the complaints.
- Product: The type of product the customer identified in the complaint.
- Sub-Product: The type of sub-product customer identified in the complaint.
- Issue: The type of issue the customer identified in the complaint.
- Sub-Issue: The type of sub-issue customer identified in the complaint.
- Company: The complaint is about which company,
- State: The state of the mailing address provided by the customer.
- Zip code: The mailing zip code provided by the customer.
- Submitted_via: How the complaint is submitted to the CFPB.
- Date_sent_to_company: The date at which CFPB sent a complaint to the company.
- Company response to the consumer: The response of the company to the consumer.
- Timely response: Whether the company gave a timely response or not.
- Customer disputed?: Whether the consumer disputed the company's response.
- Complain id: The unique identification no. of the complaints.
Feature Extraction
In this section, important features were extracted from the features present in the dataset, and date columns were transformed.
Respective columns were dropped (customer_complaint_narartive, company_public_response,
tags, company_public_response) as these columns had more than 75% null values. Moreover, they were not adding much value to the analysis.
The dtype of data columns is an object. That means, currently, pandas is seeing the date columns as
string.
To convert these strings into internal date times, we can use the pandas function to_datetime.
The upcoming step was to extract some information from the date columns. Firstly day, year, and month were extracted from the date columns as this would give us better insights about the data i.e. in which year, the month the companies got the maximum complaints.
Dropping the date columns as we have already transformed into year, month, and day columns.
customer_disputed column was treated as the target variable as if the customer were satisfied by the company resolution, he/she hasn’t disputed again.
This is an imbalanced dataset.
The new dataset has the following columns:
Data Visualization
Since most of the columns are categorical, so mainly bar plots or count plots were used because it would be easier to interpret!
Below mentions are a few examples of the notebook.
To find out the most occurring category of a product found in the complaints, a word cloud plot was used.
The above plot is a plot b/w product and count of complaints; the bar graph shows us the customer satisfaction rate.
From the above plot, we can conclude that there is a large no. of customers who are not satisfied with the service provided by the financial institution for the Mortgage product followed by Debt collection and credit reporting compared to any other product. As it may be because these products have a higher no. of complaints.
The above plot is b/w the top companies that got the max. complaints and the no. of complaints, with the bar plot showing us the timely response.
It can be inferred that among the top companies that got a higher no. of complaints, Bank of America lacks in timely_response and timely_response is very important for customer satisfaction.
The above graph shows us the no. of complaints each year.
In 2014 and 2016, the customer satisfaction rate is high as compared to other years.
Above is the violin plot b/w complaints received each year and product.
Major findings from the plot:
From the previous observations, we found that in 2015 companies got the max. no. of complaints.
Regarding that, the max. no. of complaints were from the products: credit reporting, debt collection, and prepaid card.
Conclusion from Data Visualisation
- Most of the complaints were regarding the Mortgage product followed by Credit reporting, Debt Collection, Bank account, or service.
- The major issues which were highlighted in the complaints are Loan modification, collection, foreclosure, incorrect information on credit reports, and Loan servicing.
- Bank of America got the highest no. of complaints followed by Wells Fargo, and JPMorgan Chase. The reason can be that these banks provide a large no. of product services.
- Among the top companies which got the highest complaints, Equifax is the company that provides only credit card products and other companies provide 5-6 products. It means that Equifax has the worst customer satisfaction rate. According to my view, companies could tend to get more complaints when they provide a large no. of products but Equifax is not one of them.
Data Pre-processing
It is a process of preparing the raw data and making it suitable for a machine learning model. It is the first and crucial step while creating a machine learning model.
But why do we need it?
When creating a machine learning project, it is not always a case that we come across clean and formatted data. And while doing any operation with data, it is mandatory to clean it and put in a formatted way. So, for this, we use a data pre-processing task.
The lower() function method converts all the uppercase characters in the string into the lowercase characters.
Here all the words presented in the contracted form are deconstructed with the help of regular expression.
The re.sub() function belong to the regular expression(re) module. It returns a string where all the matching occurrences of the specified pattern are replaced by the replace string.
In the given code, the stop words and all the special characters are replaced by space in the dataset.
But why do we need to remove stop words?
Stop words are available in abundance in any human language. By removing these words, we remove the low-level information from our text in order to give more focus to the important information.
Feature Engineering
Many machine learning algorithms cannot operate on label data directly. They require all input variables and output variables to be numeric that’s why I transformed the categorical data using the OneHotEncoding and Response Coding.
Initially, label encoding was done and on top of that one-hot encoding was done. You can directly go with one-hot encoding .
In the responsedict function, the positive and negative value is calculated, to create the response table. Response table is used to represent the number of data points belonging to each output class for a given category. Once we have the response table, we encode this information by adding the same number of features in the dataset as the cardinality of the class labels to represent the probability of the data point with given category, belonging to a particular class, which is stored in prob_dict for the further computation. Prob_dict is computed only on the training dataset.
In feature_name function, for a particular feature, the prob_dict is revoked using the responsedict function, and also unique label(category) present for a particular feature is stored in the unique_label for the training sample. We don’t do any computation for test samples. We just search for the values using the particular category of the feature as the key in the proba_dict and assign the corresponding value to the category and if it is not present in the proba_dict, then we assign the default value which is 0.5,0.5 is in our case. The no. of values depends on the no. of the category of the target variable which is 2 in our case i.e 0 or 1.
One hot encoding works well unless your categorical variable doesn’t take large values. But zip-code, state, and company columns have large values; that’s why I implemented response coding for them. When one hot encoded column was used, memory space error as their values is too big to handle for 16GB memory.
Normalization
It is a key step to normalize the values of columns having numerical values. Normalization is done to adjust values measured on different scales to a notionally common scales. It also improves the model performance.
After all the pre-processing, I stacked the data using “NumPy. Stack”.
But here we are missing one thing; our dataset is an imbalanced dataset so we need to either do oversampling or undersampling. But under sampling is not a good choice as we may lose some information. That’s why I selected oversampling which I have done using SMOTE.
But how does SMOTE oversample the data?
SMOTE works by selecting examples that are close in the feature space, drawing a line between the examples in the feature space, and drawing a new sample at a point along that line.
Specifically, a random example from the minority class is first chosen. Then k of the nearest neighbors for that example is found (typically k=5). A randomly selected neighbor is chosen and a synthetic example is created at a randomly selected point between the two examples in feature space.
Model Selection
Algorithms are the key factor used to train the ML models. The data fed into this helps the model to learn from and predict with accurate results. Hence, choosing the right algorithm is important to ensure the performance of your machine learning model.
The next important factor is the quantity of the data we are using to train the models. The quantity depends on the different factors for deep learning-based ML models; a huge quantity of datasets is required for algorithms.
Just like quantity, the quality of the machine learning training data set is another key factor, you need to keep in mind while developing an ML model.
I dropped all those rows which have null values in any of the columns because I had ample data points. If I would have limited data points, I had to deal with the null values differently for numerical columns, I would replace the null values with the mean of the values of the columns and for categorical values, we could take an unknown category for columns which had null values.
I have tried with no. of models and you can see the results below. I have hyper-tuned each model.
While selecting the finalized model, we need to take into consideration that the difference between the test and train performance metrics should not be large. We can take 0.2 as the upper limit. That’s why I selected logistic regression.
Parameter Tuning
Hyperparameter-tuning is important to find the possible best sets of hyperparameters to build the model from a specific dataset.
Parameters used to hyper tune logistic regression model:
Here, RandomizedSearchCV was used which is a kind of hyper tuning technique.
But why do we need to do hyper-tuning? Because it is a powerful tool to enhance the supervised learning models-improving accuracy, precision, and other metrics by searching the optimal model parameters based on different scoring methods.
Model Training
Performance metrics
As this case study is related to the classification problem, we have ample choices for the performance metrics but take into account that the performance of metrics is highly get affected by the imbalanced dataset. We have already balanced our dataset using SMOTE that’s why we are free to choose any performance metrics.
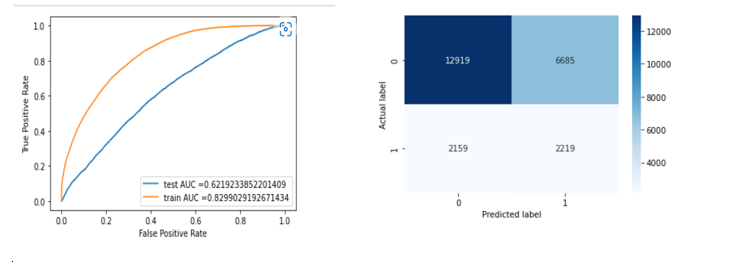
I selected accuracy, confusion metrics, and roc-auc score.
Confusion Matrix
The above code is to plot the ROC-AUC Curve. which the help of predict_proba, I have calculated the probability of getting a particular class label which will help in plotting the ROC-AUC curve.
To calculate the roc-auc score, sklearn.metrics library were used.
From the list of models, I found the logistic regression model were working well on the dataset.
Feature Importance
Firstly, I tried to get the feature importance score using the model in the built function but it was very hard to interpret which feature corresponds to which score because I have transformed the categorical features using one-hot encoding.
Then I tried it using PCA
This printed the eigen values corresponding to each eigen vectors.
The importance of each feature is reflected by the magnitude of the corresponding values in the eigenvectors (higher magnitude - higher importance).
I concluded that complaint_id, date_sent_to_company_year, date_sent_to_company_month, date_sent_to_company_day, date_received_year, date_received_month,ddate_received_day features not contribute at all in the model training as we get zero eigen values corresponding to them.
From the above plot, we could infer that after 70 features variance is not changing much. So, we can drop all other features. Unnecessary features decrease training speed, decrease model interpretability, and most importantly, decrease generalization performance on the test set.
External Links
Please find the attached project link below:
https://github.com/Vaishali88/customersatisfaction
Referenced Research paper:
[1. http://ebot.gmu.edu/bitstream/handle/1920/12216/machine_learning_models_for_customer_relationship_analysis_to_improve_satisfaction_rate_in_banking.pdf?sequence=1&isAllowed=y](https://1. http://ebot.gmu.edu/bitstream/handle/1920/12216/machine_learning_models_for_customer_relationship_analysis_to_improve_satisfaction_rate_in_banking.pdf?sequence=1&isAllowed=y)
Thank you for going through the notebook! I hope it was helpful somehow.